Conflicting Signal Analyzer
How to Use This Tool
Input your hard data (e.g., GDP growth, employment) and survey data (e.g., consumer sentiment) values.
This tool calculates the divergence percentage between the two and provides actionable insights based on the article's framework.
Hard Data Input
Survey Data Input
Results
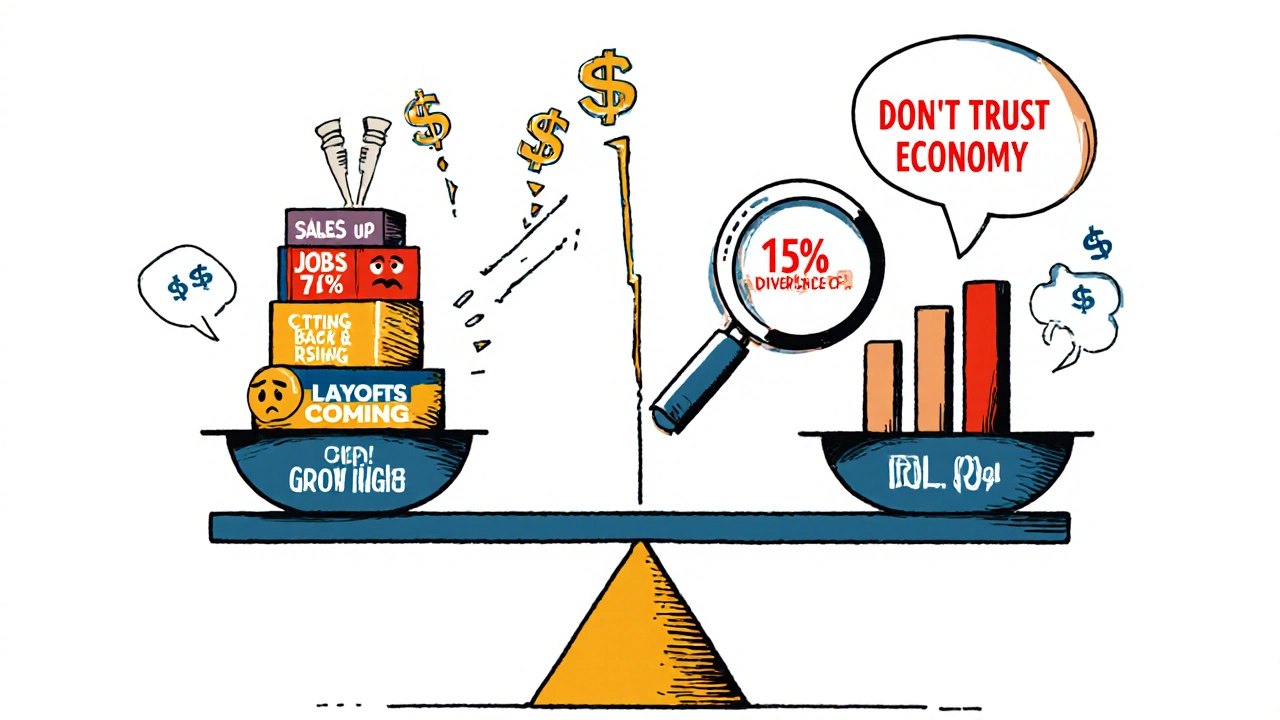
Imagine this: your sales numbers are up 7% this quarter. Your inventory is full. Your payroll is running smoothly. But your customer surveys? They’re falling apart. People say they’re cutting back. They’re worried about layoffs. They don’t trust the economy. Which one do you believe? The numbers or the voices?
This isn’t a hypothetical. It’s happening right now. In early 2024, U.S. employment data showed record job growth. GDP kept climbing. But consumer sentiment surveys hit their lowest levels since the pandemic. The Federal Reserve called it a "significant disconnect." And businesses? They were stuck. Some cut marketing budgets. Others doubled down on inventory. One ended up with $4.3 million in unsold stock. Another lost $2.7 million in missed sales.
Hard data and survey data aren’t just different-they’re often at war. And if you don’t know how to read the signs, you’ll make the wrong call. The key isn’t picking one over the other. It’s learning how to listen to both at the same time.
What Hard Data Really Tells You (And What It Doesn’t)
Hard data is the backbone of economic decision-making. It’s measurable. It’s audited. It’s backed by millions of records. Think: unemployment rates, GDP growth, retail sales figures, industrial production, and job openings. These numbers come from government agencies like the Bureau of Labor Statistics and the Bureau of Economic Analysis. They sample tens of thousands of businesses and households. Their error margins are tiny-often under 5%.
That’s why markets react violently to hard data releases. A single jobs report can move stock indexes by 1-2%. Why? Because hard data reflects what’s already happened. It’s the past made concrete. If factories are producing more, people are being hired, and stores are selling more TVs, then the economy is growing. No opinion needed.
But here’s the catch: hard data is slow. The official GDP number for Q4 2023 wasn’t finalized until February 2024. By then, consumer behavior had already shifted. Hard data also can’t tell you why things are changing. It won’t tell you if people are buying less because they’re scared, angry, or just tired of inflation. It just says: “They bought less.”
What Surveys Reveal That Numbers Can’t
Surveys-like the University of Michigan Consumer Sentiment Index or the Conference Board’s Consumer Confidence Index-capture what people think, feel, and expect. They ask: “Do you think the economy will improve next year?” “Are you planning to buy a car?” “Do you feel secure in your job?”
These aren’t just opinions. They’re behavioral predictors. Harvard Business School found that a 10-point drop in consumer sentiment leads to a 0.8% drop in discretionary spending-even when jobs and income haven’t changed. Why? Because fear changes behavior. If people believe a recession is coming, they stop spending. And that spending drop? That’s what actually triggers the recession.
Surveys also move fast. You can get results in 48 hours. That’s why companies use them to test new products, gauge reactions to price hikes, or spot early signs of customer churn. But they’re fragile. A single word change in a survey question can swing results by 8-12 points. Political polarization skews them too. During the 2020 election, sentiment scores diverged by 28 points between Democrats and Republicans-same economy, totally different perceptions.
The Great Divide: When Numbers and Feelings Clash
In 2022 and 2023, the gap between hard data and soft data was the widest in over a decade. The economy was strong. Jobs were plentiful. Wages were rising. But consumers? They felt like the sky was falling. Inflation was still high. Media headlines were grim. Social media was full of “layoff panic” stories. Even though the data said “growth,” the surveys screamed “crisis.”
Bloomberg Economics calculated the resulting forecast error at $1.2 trillion. That’s how much companies over- or under-estimated consumer spending based on trusting one side and ignoring the other.
Here’s the real danger: people default to what confirms their bias. Executives who think the economy is fine? They ignore the surveys. Managers who fear a downturn? They treat every negative survey as gospel. A Harvard Business Review study found 68% of executives lean toward the data that matches their existing view. That’s not analysis. That’s confirmation bias in action.
And it’s expensive. One retail analytics director on Reddit admitted he trusted the hard data-sales were up-so he didn’t cut inventory. Three months later, customers stopped showing up. He was stuck with $4.3 million in dead stock. Meanwhile, a banking executive cut marketing by 30% after a sentiment dip. Transaction data showed no real spending drop. They lost $2.7 million in potential revenue.
How to Bridge the Gap: A Practical Framework
You don’t have to choose. You need a system.
Here’s what works, based on real practices from companies using both data types successfully:
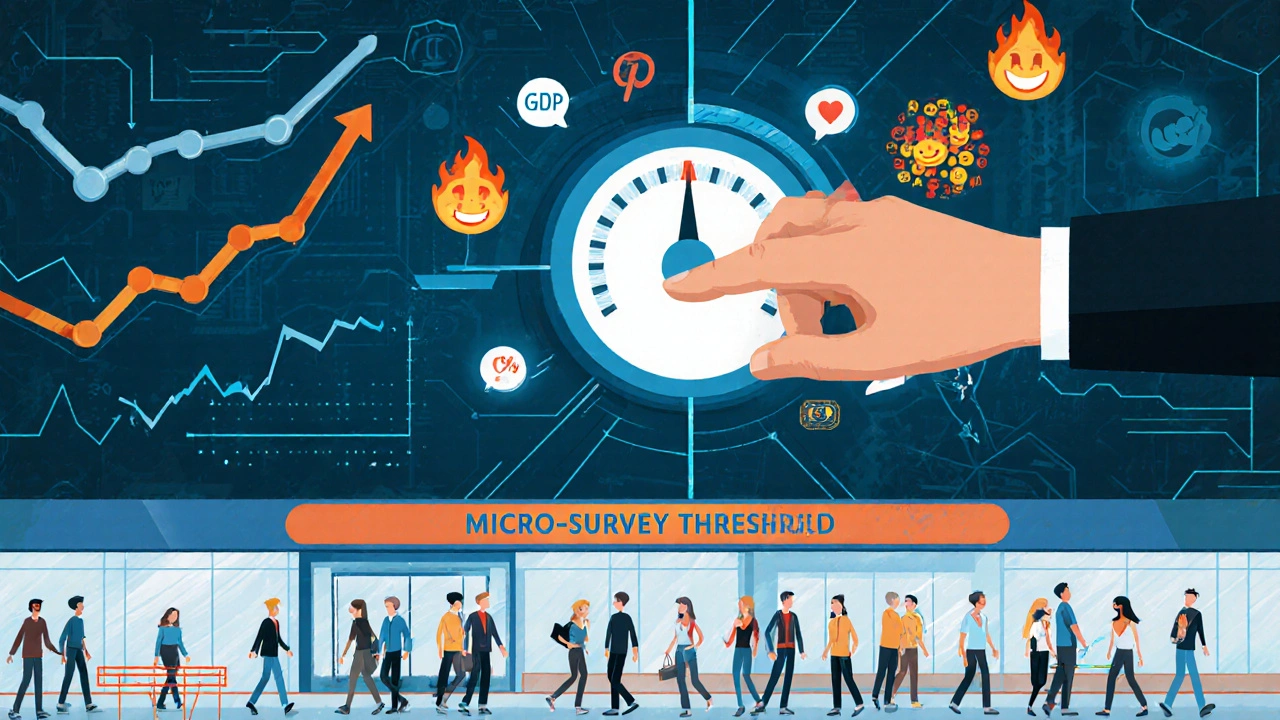
- Set a divergence threshold. When hard and soft data differ by more than 15%, trigger a response. That’s the red flag.
- Run a micro-survey. Don’t wait for the next monthly poll. Ask 5,000-10,000 of your own customers: “What’s changed in your spending?” “What are you worried about?” Salesforce used this to avoid a $500K product launch mistake in 2023.
- Check the source. Are the surveys well-designed? Are the questions neutral? Are they sampling the right people? Poorly worded surveys are worse than useless-they’re misleading.
- Look for third-party signals. Is foot traffic down at your stores? Are credit card transactions slowing? Are job postings being pulled? These are hidden hard data points that confirm or contradict surveys.
- Don’t overreact. One bad survey doesn’t mean disaster. One strong GDP number doesn’t mean everything’s fine. Look for trends over time.
Organizations that use this kind of reconciliation process reduce decision errors by 37%, according to McKinsey. That’s not a small win. That’s profit saved.
The Future Isn’t Choosing-It’s Synthesizing
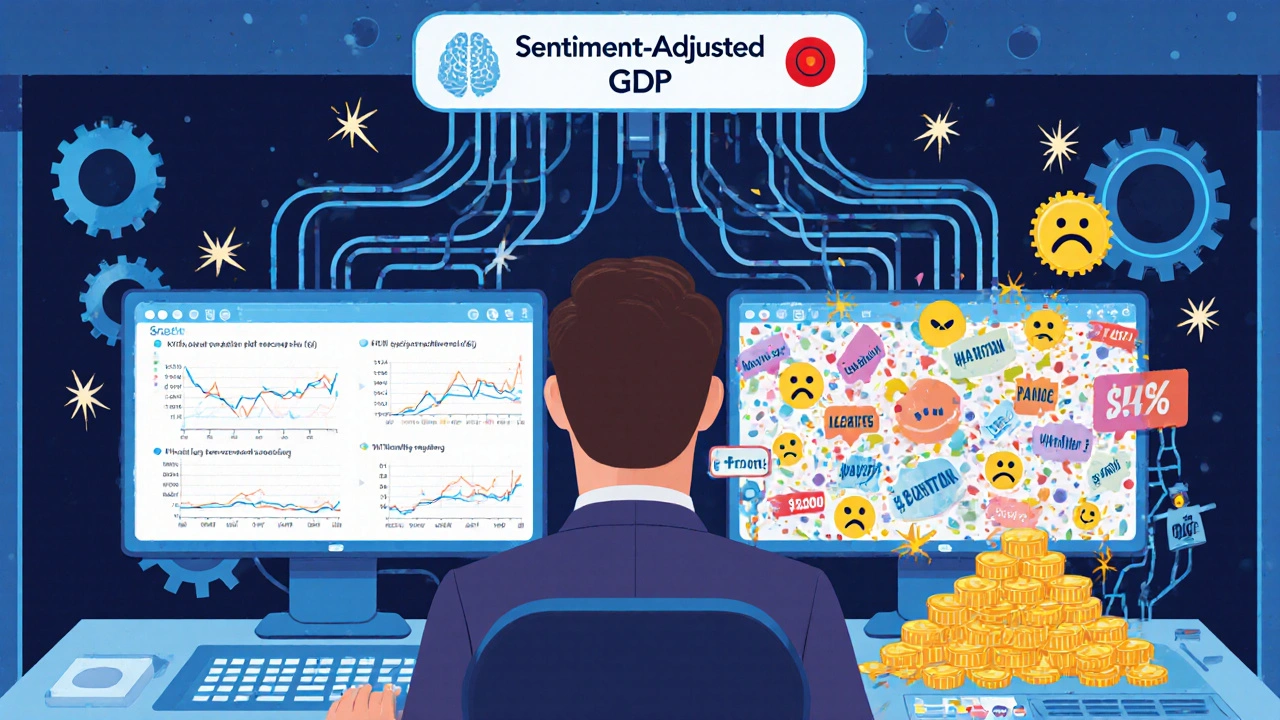
The Federal Reserve is starting to merge the two. In May 2024, they announced “Sentiment-Adjusted GDP”-a new economic model that blends traditional hard data with real-time consumer sentiment from digital sources. MIT’s computer science lab can now turn open-ended survey answers into quantifiable scores with 89% accuracy using AI. JP Morgan cut data reporting time from 30 days to 4 hours using blockchain.
By 2027, IDC predicts 95% of enterprise analytics will automatically reconcile hard and soft data. The dichotomy won’t disappear-but the need to choose between them will.
Until then, the rule is simple: hard data tells you where you’ve been. Surveys tell you where you’re headed. Ignore either one, and you’re flying blind.
What to Do When the Signals Conflict
Here’s your quick-action checklist when hard data and surveys pull in opposite directions:
- Pause major decisions. Don’t hire, cut, or launch until you’ve investigated.
- Check your own transaction data. Are your customers actually spending less? Or is it just what they’re saying?
- Run a 72-hour micro-survey with your top 10% of customers.
- Look for media or social trends that might be skewing sentiment.
- Wait for the next hard data release. If sentiment stays low but hard data holds, the fear may be temporary.
- If both start moving the same way-then you know you’re in a real shift.
There’s no magic formula. But there is discipline. And discipline beats instinct every time.

Dave McPherson
November 2, 2025 AT 00:30Look, if you’re still treating surveys as ‘soft data’ like some kind of 2012 MBA textbook, you’re already dead in the water. People don’t ‘feel’ bad because they’re irrational-they’re reacting to real inflation, real wage stagnation, and a media ecosystem designed to sell panic like it’s a Netflix series. Hard data is a corpse with a pulse; surveys are the ghost screaming from the attic. You don’t choose one-you weaponize both. And if you’re not using NLP to parse open-ended responses into behavioral vectors, you’re not even playing the game. This isn’t economics-it’s predictive anthropology with a Bloomberg terminal.
Julia Czinna
November 3, 2025 AT 14:27I appreciate how you framed this. It’s easy to get caught in the noise, but the real insight is in the gap-not the data itself. I’ve seen teams ignore sentiment because ‘sales are up,’ only to watch retention crater three months later. The micro-survey tactic you mentioned? Brilliant. I ran one with our top 5% customers last quarter-turns out they weren’t spending less, they were just switching to private-label brands. Hard data didn’t show that. A simple ‘What’s changed?’ did. Sometimes the quietest voices tell you the most.
Kenny McMiller
November 5, 2025 AT 07:44It’s not a disconnect-it’s a dissonance. Hard data reflects the system’s output; surveys reflect the substrate of human anxiety beneath it. The economy isn’t a machine-it’s a nervous system. GDP is the heartbeat. Sentiment is the cortisol spike. You can have a healthy pulse and a full-blown panic attack. The Fed’s new Sentiment-Adjusted GDP model? That’s the first step toward a post-positivist economics. We’re moving from ‘what happened’ to ‘what it felt like to happen.’ The next frontier? Real-time emotional telemetry via wearable biometrics and social sentiment graphs. We’re not predicting behavior anymore-we’re predicting affective states. And yeah, that’s terrifying. But also… inevitable.
Laura W
November 6, 2025 AT 13:16Y’all are overcomplicating this. I run a small boutique in Austin. My sales are up 12% YoY. But my regulars? They’re whispering about layoffs. One lady said, ‘I’m buying this dress, but I’m not buying anything else this month.’ That’s the signal. I didn’t need a survey. I just listened. So I paused my big summer launch, offered a ‘pay-what-you-can’ week for locals, and doubled down on loyalty texts. No fancy AI. Just human conversation. Hard data says I’m thriving. My customers say they’re scared. Guess what? I’m thriving *because* I listened. Stop over-engineering. Talk to your people.
RAHUL KUSHWAHA
November 7, 2025 AT 23:01Thank you for this. 🙏 I work in supply chain in India-we see the same thing. Global orders up, but local retailers say customers are buying half the quantity. We started asking: ‘What are you cutting?’ 78% said ‘entertainment, dining, non-essentials.’ So we shifted to smaller SKUs, bundled essentials, and delayed luxury launches. No big data needed-just asking. Simple. Quiet. Effective.